

First Quarter 2021 Market Update and a Close Look at Inflation
First Quarter Market Update
The first quarter of 2021 witnessed a boost for the economy as the continued expansion of the vaccine rollout and the passage of the almost $2 trillion stimulus bill was reflected in rising gross domestic product (GDP) estimates, a further move up in equity prices, and a steady rise in interest rates.
The S&P 500 Index, which measures large stock performance, is up 5.77% through the end of March and the Dow Jones Industrial Average measure of the stock performance of 30 large stocks is up 7.76%. The tech-heavy NASDAQ index is up 2.78 % for the first quarter of the year. Within equities, the stock market has seen gains across sectors. Outsized gains have come from areas most aligned to an economic reopening, while last year’s best performer, technology, has largely consolidated its prior strength, acting as a source of capital. Investors should not be surprised if the historically substantial gains experienced over the past 12 months become more normal (with volatility in pullbacks) over the next 12 months. Given that optimistic view, weakness could represent buying opportunities.
The yield on the 10-year Treasury hit its highest level in more than twelve months. Yet, domestic equity markets managed to gain ground in the first quarter of 2021, as noted above, seemingly in the hope of vigorous economic activity for the rest of the year. Federal Reserve policy remains accommodative.
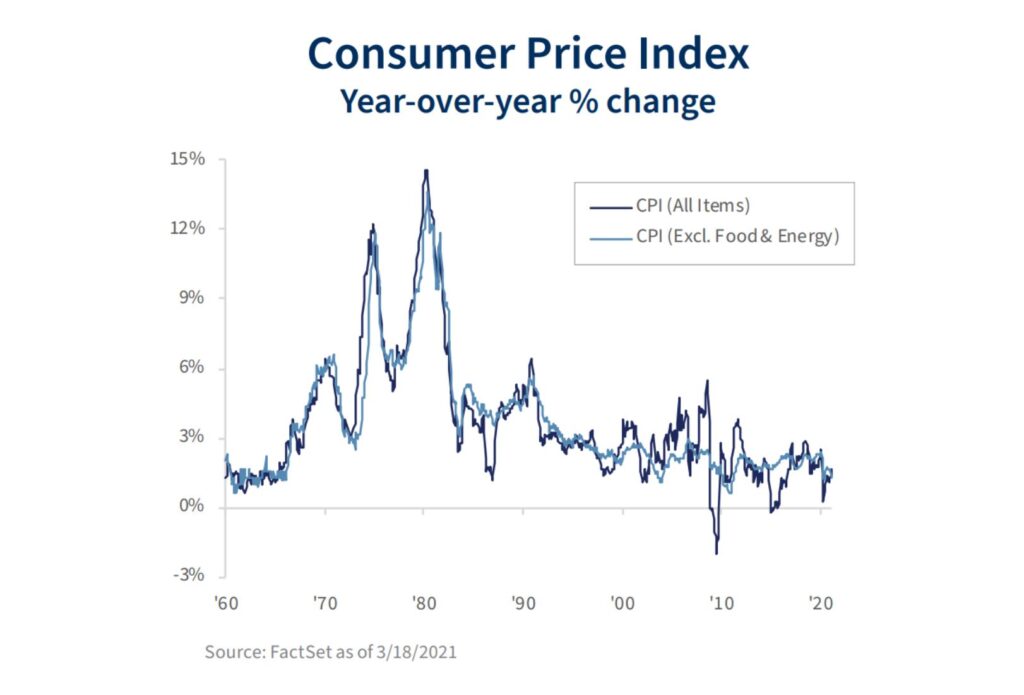
A Substantial Surge in Inflation is Not Likely
Some may remember the Great Inflation present in the 1970s and early 1980s. Just how concerning is inflation nowadays? Some fret over the sharp rise in commodity prices; others are concerned about aggressive monetary and fiscal policy. However, while we may see a pickup in prices that were restrained due to the pandemic – a lasting period of substantially higher inflation appears unlikely. Here’s why:
- The Consumer Price Index is expected to rise to over 3% for the 12 months ending in April, but that merely reflects a rebound from the low figures of a year earlier. Notsomuch “new” inflation. The Consumer Price Index (CPI) measures the cost of a “basket of goods and services” over time. The basket represents what a typical consumer would purchase and will change periodically as new products and services are introduced.
- Sharp increases in commodity prices are like misbehaving kids—they get a lot of attention. However, former Federal Reserve Chairman Ben Bernanke noted, “the direct effects of commodity price inflation on consumer inflation are empirically minuscule, both because raw material costs are a small portion of total cost and because part of any increase in the cost of materials tends to be absorbed in the margins of final goods producers and distributors.”
- While the pandemic has disrupted supply chains, lengthened supplier delivery times, and raised input costs, these pressures should recede as vaccines are distributed, and supply chains recover. Even as prices of industrial supplies and raw materials have increased, U.S. firms continue to face difficulties in passing higher costs along, and there is little inflation in imported finished goods.
- Money supply measures surged in the pandemic. However, the relationship between the monetary aggregates (M1, M2, etc.1 ), growth, and inflation broke down in the late 1980s. The velocity, or turnover, of money in the economy has slowed. The surge in liquidity during the pandemic helped relieve financial strains, supported growth, and lifted asset prices, but has not boosted inflation.
- What about the US budget deficit? Large federal budget deficits do not cause higher inflation. In the 1980s, the U.S. ran deficits on the order of 5% of gross domestic product (GDP), while inflation fell. The Japanese government has a debt-to-GDP ratio of over 235% yet continues to battle deflation – a general decline in the price level.
- Some people may remember when inflation rose to double digits in the 1970s and early 1980s. The difference between now and then is inflation expectations. Following the OPEC oil shocks, the CPI rose sharply, reflecting higher energy prices. Unions were able to contract for higher wage gains and non-union wages followed. Inflation became embedded in the labor market and inflation expectations rose. In the private sector, union membership is now a fraction of what it was a few decades ago.
Unless longer-term inflation expectations become wildly unanchored, inflation is unlikely to become a serious issue.